
.webp)
Opening now...

A CRM can help you track contacts, conversations, and deals throughout each stage of your workflow.
It’s the backbone of your daily work, but you’re missing out on a lot of value if you’re not taking advantage of CRM analytics. Reporting tools allow you to analyze your processes can give you powerful insights to:
Reports have always been a valuable part of your CRM with Streak. Now they’re getting an upgrade with advanced features that allow you to better understand and grow your business.
Advanced reports in Streak add customizable filters to your existing reports so you can achieve more granular analysis of your pipelines. They also include comparison charts to compare different aspects of your process, products, and business.
Advanced reports use the power of saved views to help you answer questions and find useful metrics in your Streak reports dashboard.
Once you create a saved view, you can use it as a data source for your reports.
You’ll start with an existing report, like a funnel report or a “value in pipeline” report, and then create or select an existing saved view as your data source. Your report will now show you a specific dataset and allow you to compare different groups of data within your pipeline.
Some common ways advanced reports can give you more specific CRM analytics include:
Learn how to set up some of the most popular advanced reports below.
Need a little refresher on saved views before we dive in? No worries, we got you.
Saved views allow you to create segments that filter, sort, and group any of the data or magic columns in your pipeline. They update in real time and are a powerful way to identify important work and prioritize your time.
For example, you could create a saved view to see opportunities in your “Leads” stage that haven’t had any interaction in 14 days. Once you know which of your leads could use some attention, you can follow up with a mail merge to keep them engaged… or send a breakup email.
You can also use saved views to group your pipeline and compare data by sales rep, product type, or any other column in your pipeline.
Filters and comparison charts give you a toolbox to create and customize meaningful reports in your CRM. Once you learn how to create saved views and apply them to reports, you’ll have access to a huge cache of powerful and actionable CRM analytics.
Here are our tips for creating reports that give you actionable CRM analytics in Streak:
Not advice you’ll get every day, but it’s best to start at the end when you’re creating a report or looking for useful analytics.
Specifically, start with the question you’re trying to answer and then think about what the answer should look like. Try to be as specific as possible when framing your question.
For example, if your goal is to grow your business in a certain sector, your question might be:
In the last year, how are leads in this sector converting compared to other sectors?
Then, think about what your answer should look like – not the actual data, but the format. Since you want to learn about conversions, a conversion funnel report is likely your best option. You’ll also want to compare each sector so you can see how each one is performing.
Once you’ve determined exactly what you’re trying to learn from your analytics, work backwards to find the data points you need to be looking at. These data points will help you create the report you need.
In this case, you’ll need to pinpoint:
Don’t be afraid to pull out a pen or your go-to notes app to jot down the questions you want to answer and a list of data points just like we did above – it can help you quickly get the analytics and insights that you need.
Now you’re ready to create a saved view to filter or group your pipeline. Remember:
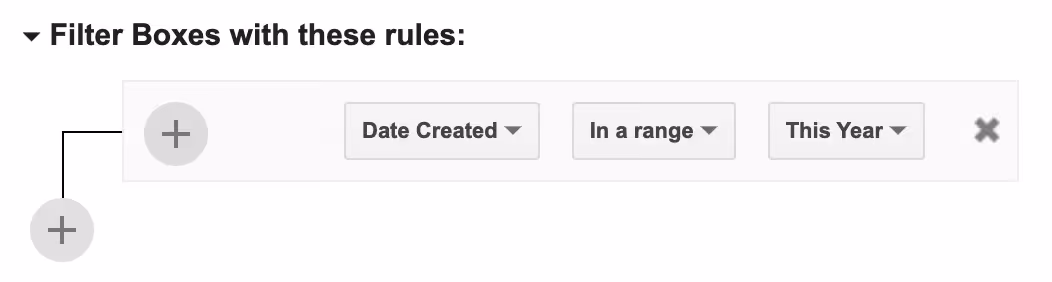
Filters select the datasets that will be included in your report. Any boxes that meet your filter criteria will be included in the report.
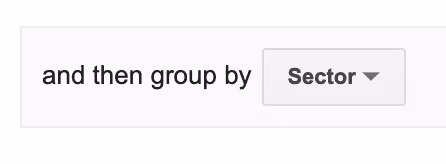
Group by creates a comparison chart of that data point in your report.
Since we want to see leads created this year, start by filtering by “Date Created”.
Any time you want to compare different data points, use the “group by” function in your saved view.
Comparison charts are available for a handful of reports right now, and we’ll be adding them to more reports soon.
Watch our Streak University video lesson for step-by-step instructions on how to create saved views for your pipelines and to use in advanced reports.
Based on the question you formed, add the report that will help answer your question to your reports dashboard in Streak.
In this case, we’re interested in conversions so we’ll add a funnel report to our dashboard. If you were interested in your sales reps' activities, you might want to add an interaction report.
To add a report to your reports dashboard:
Now that you’ve created a saved view and added a report to your dashboard, you can select the saved view as a data source for your report.
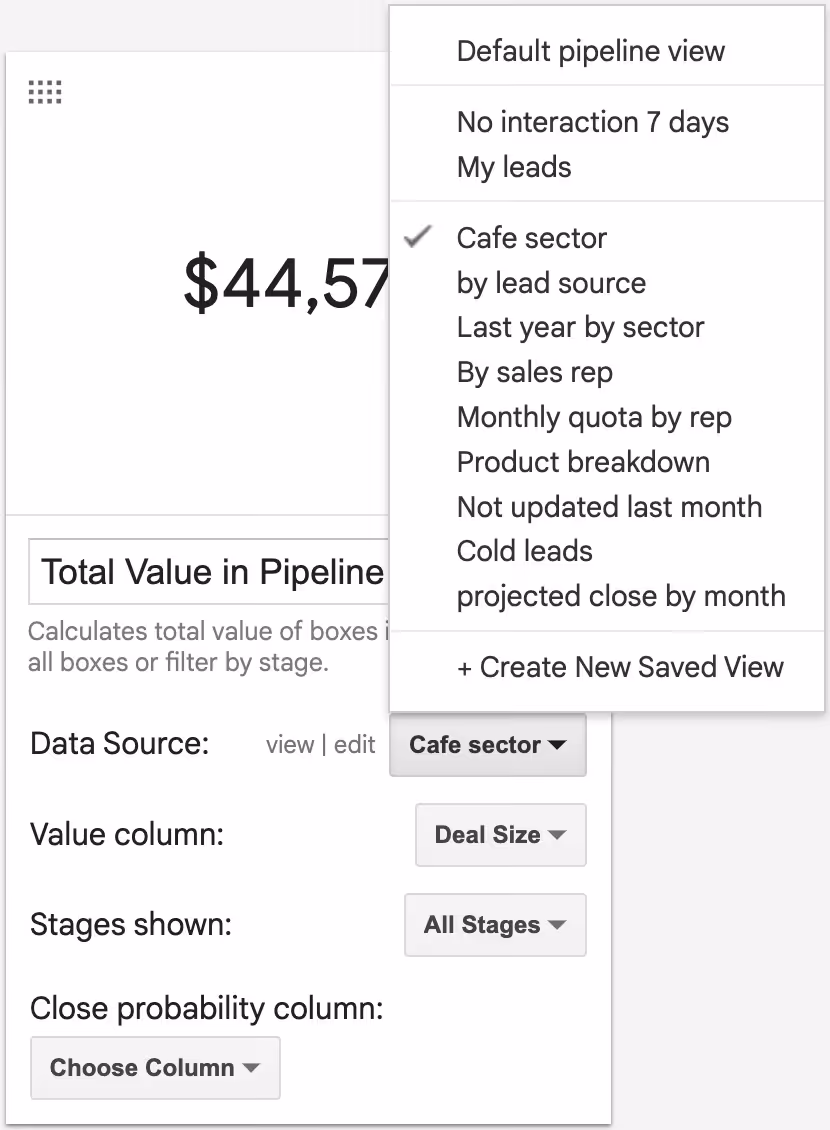
Click the arrow next to the report name to see configuration options for the report.
Click the dropdown menu for the Data Source to see a list of your existing saved views. Select a saved view or choose to create a new saved view at the bottom of the menu. When you apply a saved view, you may notice the data in your report changes – this is because your report is now only showing the data that meets the filter criteria in your saved view.
Learn how to create a saved view for some of the most commonly used advanced report types below.
It’s no surprise that one of the most useful saved views also makes for a useful advanced report filter.
Creating a saved view to see only your leads allows you to focus on your work in your pipeline and you’ll be able to quickly see your own performance in the reports dashboard.
The best part about this saved view is that it works for everybody on your team. By using the “assigned to me” filter, Streak will show boxes and data assigned to the logged in user.
Filter boxes with these rules: Assigned to is any of Me
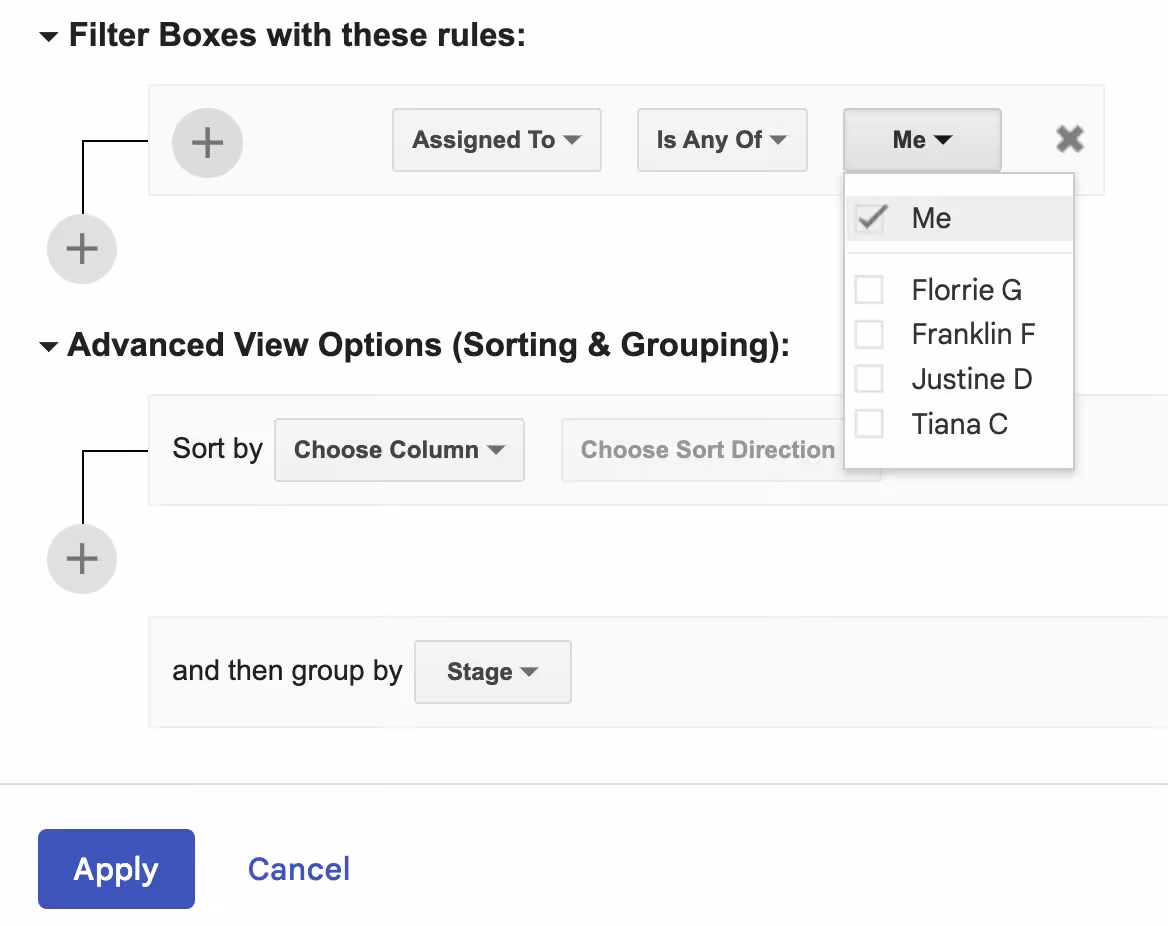
Once you create this saved view, you can apply it to nearly any report in your dashboard.
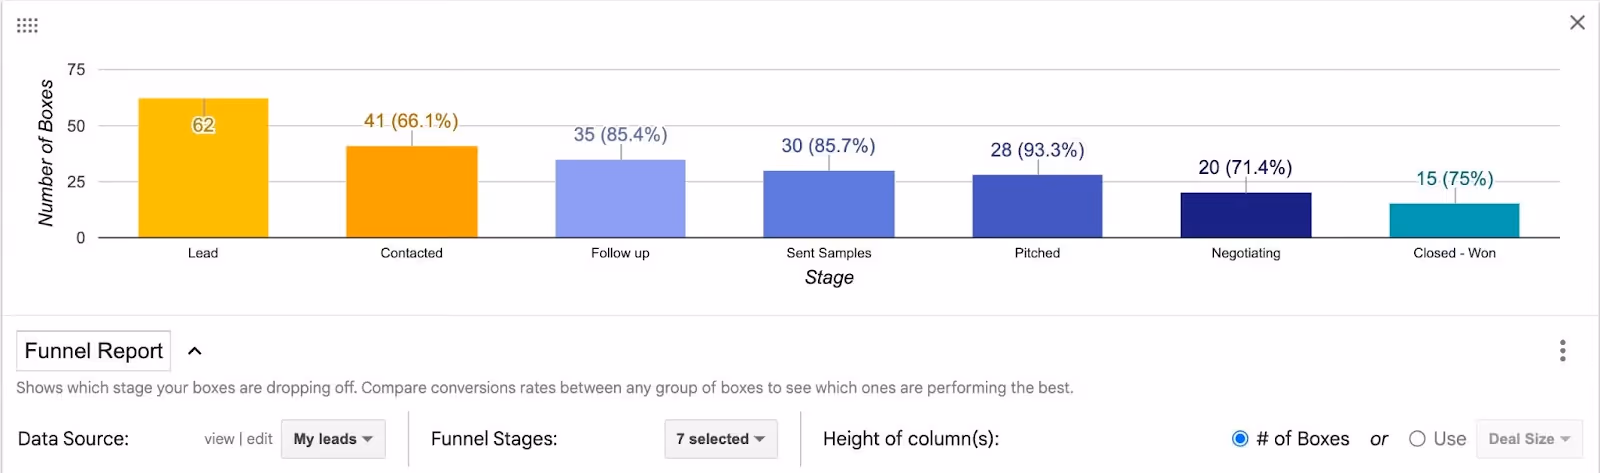
Try it with a funnel report to see where your assigned leads are dropping off throughout the funnel and how you can improve conversions.
Understanding how each of your sales reps (or recruiters, etc.) is performing can help you better manage your team in a number of ways.
Group by Assigned To
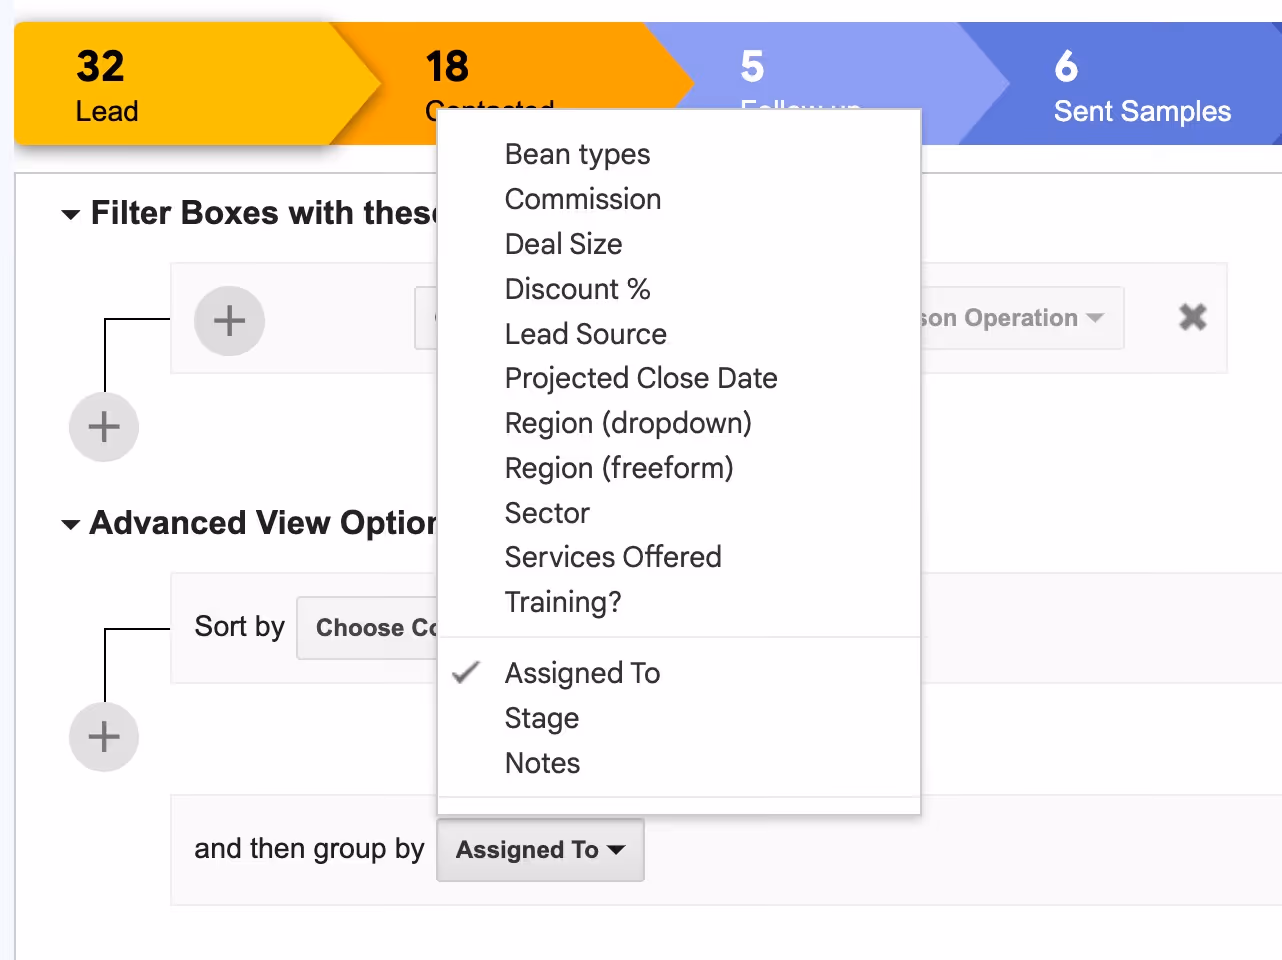
This simple saved view uses the “group by” feature to compare data for each member of your team.
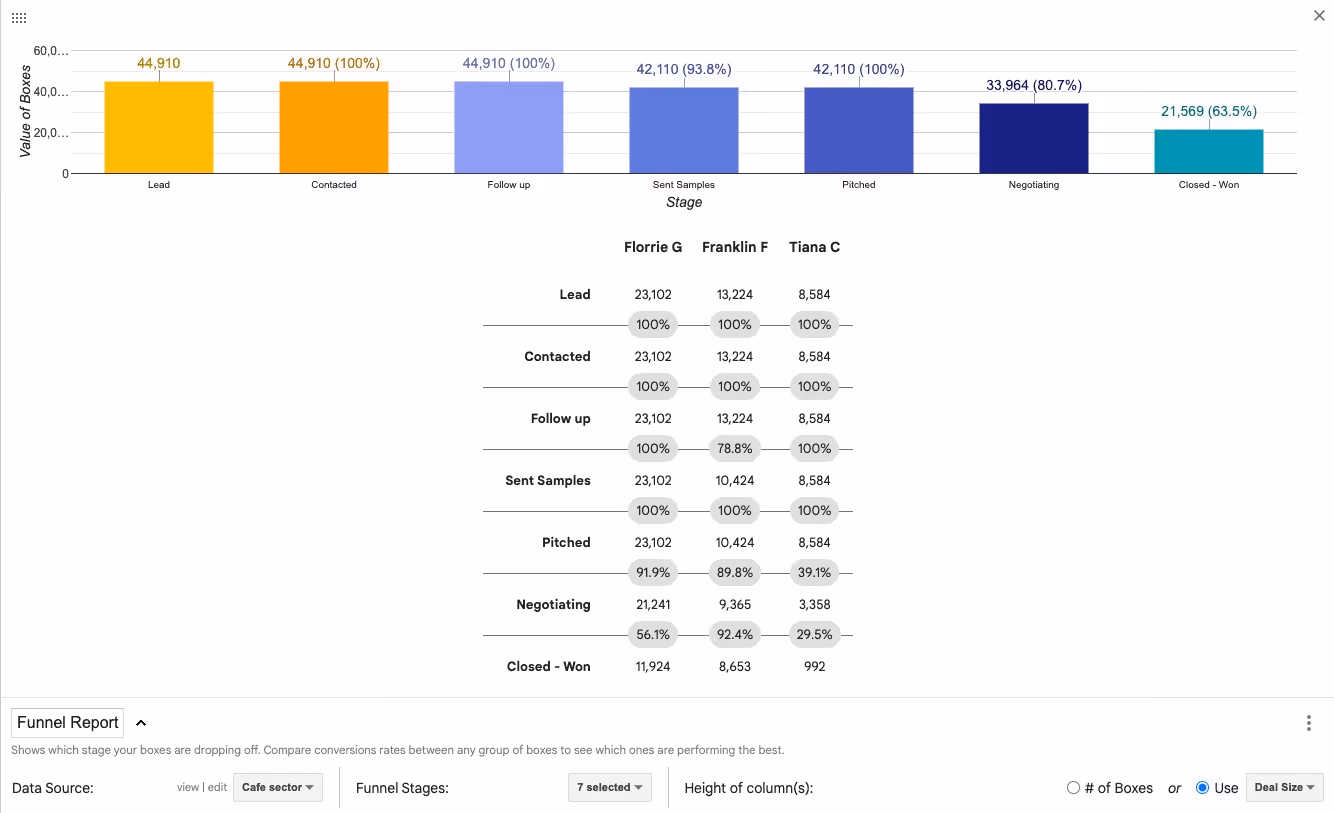
Using a “group by” in your saved view will enable comparison charts in certain reports that help you quickly see your team member’s strengths and weaknesses. In this case, we’ll look at a funnel report.
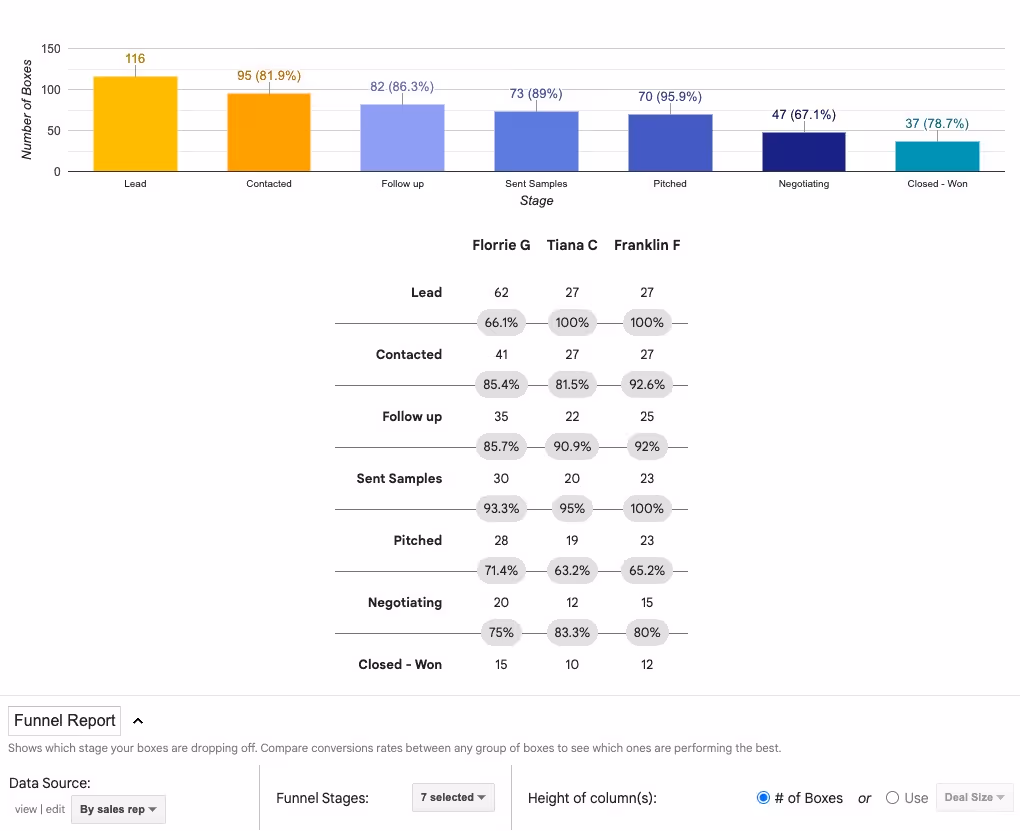
For example, in this report we could see that Florrie is leaving about one third of their leads untouched, since they’re only moving 66.1% into the Contacted stage. As Florrie’s manager, we could see if there’s an issue with lead quality, or make a plan to contact the remaining third of their leads. Since Florrie was assigned nearly twice the amount of leads as the other reps, maybe we just need to more evenly distribute lead assignments.
We could also see that Tiana is leading the team in moving leads through negotiations to close deals. We could learn more about Tiana’s negotiation tactics and even ask them to lead a team training to share best practices.
Filtering by a certain type of deal gives you actionable insights to review and plan your work. You could filter by a number of variables, such as product type, customer type, regionality - anything in your pipeline columns is up for grabs here.
In this example, we’ll look at the value in our pipeline for a specific sector, or customer type.
Sector Is any of Cafes
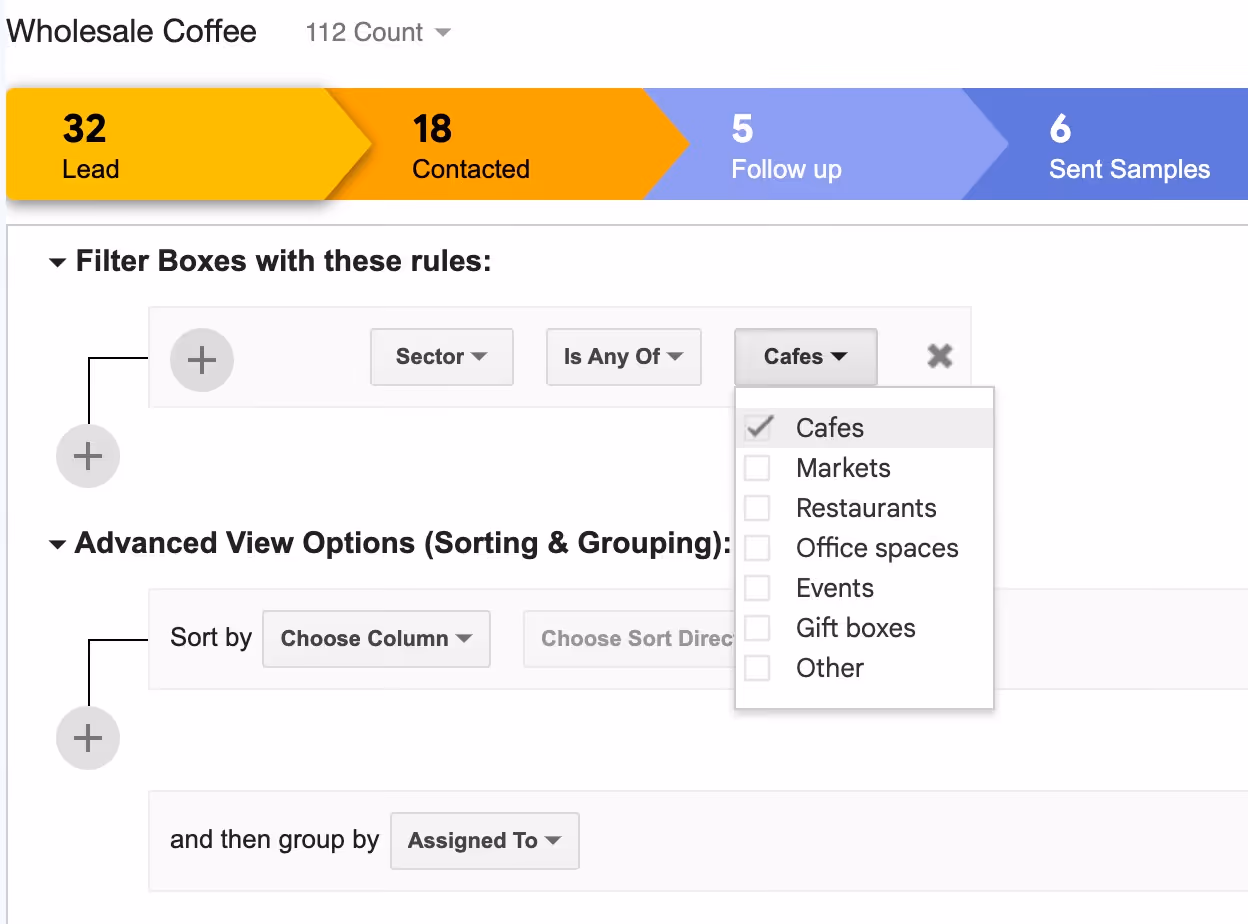
To find the value in your pipeline for a certain type of deal, add a “Total value in pipeline” report to your reports dashboard. You could also use a “Value by person” report.
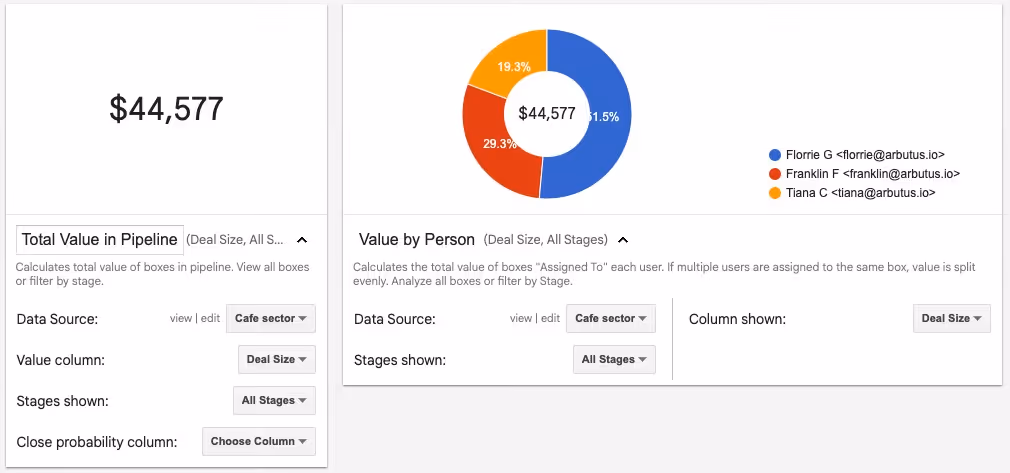
This will use the “Deal Size” column to show you the total dollar value in your pipeline for this type of deal. Seeing the value broken out by person gives you insights to who is working with this type of deal the most.
You could also use a funnel report to view this data in more detail. You’ll want to:
Streak’s CRM is designed to be customizable because we know that no two businesses or processes are alike.
We get excited about advanced reports because they give you tools to create detailed and targeted reports that make a real difference in how you manage your unique pipeline and team.
Whether you’re trying to help your sales team close more deals or make inventory forecasts for next quarter, you can create reports that help you understand what’s going on at every stage of your business and compare data points between different variables.
Stay in the loop with Streak’s latest features and insights.


